

How can we help?
Understand your Dashboard
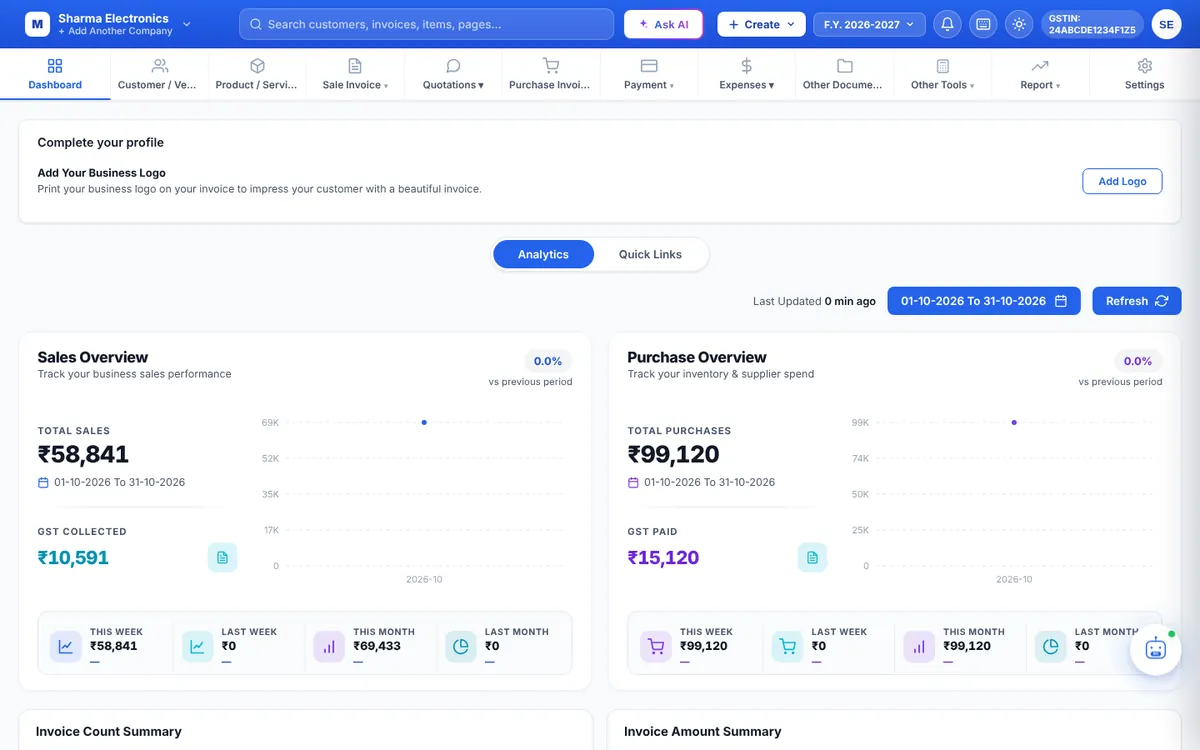
The Dashboard is the first page you see after logging in. It gives you a picture of your business for the period you choose.
Where to find it: Dashboard tab (keyboard Alt + H)
Choose the period
Click the date button (for example 01-10-2026 To 31-10-2026) and pick Today, Yesterday, Last 7 Days, Last 30 Days, Last Month, Last 3 Month, Last 6 Month, Last 1 Year, Current Month or Current F.Y., or select your own dates and click Apply. Click Refresh to reload the numbers.
The cards
| Sales Overview | Total sales and GST collected for the period, with this week, last week, this month and last month, and the change compared with the previous period. |
| Purchase Overview | Total purchases and GST paid (your input tax credit) for the period. |
| Invoice Count / Amount Summary | Number and value of sale and purchase invoices over time. |
| Sales Outstanding / Purchase Outstanding | What customers owe you and what you owe suppliers, split into Current, 1-15 days, 16-30 days and 30+ days. These cards always show all-time figures and do not follow the date filter. |
| Total Sale – State-wise | A map and list of your sales (or purchases) by state. |
| New vs Existing Customer Sale | How much of your sale came from new customers. |
| Expense & Income | Total expense, total income and net balance, with a chart over time. |
| Payment Summary | Share of your billed amount that is received, pending and overdue. |
| Best / Least Selling Products | Products sold the most and the least by quantity. |
| Low Stock | Items that are low, at zero or negative. Use the filter to switch between them. |
| Inward / Outward Payment | Totals of money received and paid. |
| Inventory | Total products and quantity, with In Stock, Zero Stock, Low Stock and Negative Stock counts (all-time). |
| Top Customers, Recent Activities, Recent invoices | Your biggest customers, the latest actions in your account and your latest invoices. |
Quick Links
Switch from Analytics to Quick Links above the cards to see a page of shortcuts to every section, grouped by area (Parties, Products & Services, Sales, Purchases, Reports and more).
Tip: The dashboard colours can be changed in Settings → Colour / Font → Dashboard Analytics Colours.